Want to share your content on R-bloggers? click here if you have a blog, or here if you don't.
Terence Wood, Chris Hoy and Jonathan Pryke recently published this paper on The Effect of Geostrategic Competition on Public Attitudes to Aid. I was interested a) because of my past professional engagement with public attitudes to aid (my very first real, full time permanent job was a a community campaigns coordinator for Community Aid Abroad, which later rebranded as Oxfam Australia) b) because Terence and I used to share a cubicle in NZAID / DFAT and c) because I am particularly interested in experiments at the moment, and this was a nice example of an experiment in a non-medical area with reproducible data and code.
The experiment was to compare members’ of the Australian and New Zealand public attitudes to overseas aid, with and without the “treatment” of being exposed to written vignettes of varying degrees of forcefulness about China’s rise as an aid donor in the Pacific. Data collection was by questions included in Ipsos MORI online omnibus surveys.
From the Australian findings:
“As expected, treating participants reduced hostility to aid and increased support for more aid focused on the Pacific. Counter to expectations, however, treatment reduced support for using aid to advance Australian interests.”
The result in the first sentence, but not the second, was replicated with the New Zealand subjects (with questions appropriately reworded for New Zealand, rather than Australia, of course).
The finding about treatment reducing support for using aid to advance Australian interests was a surprise. China’s aid activities in the Pacific are fairly transparently undertaken with a heavy dose of geo-strategic competitive motivation. The researchers had expected, based on other literature to date, that being exposed to this phenomenon would make Australians more inclined to use our own aid program the same way.
Reproducing results
Terence and friends have made the data and Stata code for the analysis available on the Harvard Dataverse. My first move was to check that I could reproduce their results. Here’s the original table of results from the Australian analysis:

Regression results
That table combines the regression coefficients in the odd-numbered columns with contrasts between the ‘Measured’ and ‘Forceful’ versions of the vignette in the even-numbered columns. I found this mixture presentation slightly untidy so will reproduce these in two different steps. Here’s my reproduction of columns (1), (3) and (5) from that first table ie the regression results:
Table 1a – Regression results, experiment with three response variables, Australian public
Regression results for Australians| Dependent variable: | |||
| Too much aid | More to Pacific | Help Australia | |
| (1) | (2) | (3) | |
| Measured vignette | -0.079*** | 0.052* | -0.063** |
| (0.029) | (0.028) | (0.028) | |
| Forceful vignette | -0.093*** | 0.089*** | -0.097*** |
| (0.029) | (0.028) | (0.028) | |
| Control group mean | 0.518*** | 0.257*** | 0.598*** |
| (0.020) | (0.020) | (0.020) | |
| Observations | 1,816 | 1,647 | 1,844 |
| R2 | 0.007 | 0.006 | 0.007 |
| Adjusted R2 | 0.006 | 0.005 | 0.005 |
| Residual Std. Error | 0.497 (df = 1813) | 0.459 (df = 1644) | 0.497 (df = 1841) |
| F Statistic | 6.077*** (df = 2; 1813) | 5.150*** (df = 2; 1644) | 6.028*** (df = 2; 1841) |
| Note: | *p<0.1; **p<0.05; ***p<0.01 |
Good, I seem to have exactly the same results. Here’s my R code that does the analysis so far for both the Australian and New Zealand results.
Post continues below R code
# Wood, Terence, 2020, "Replication Data for The effect of geostrategic# competition on public attitudes to aid", https://doi.org/10.7910/DVN/3VVWPL,# Harvard Dataverse, V1, UNF:6:a3zSXQF/lkQQhkGYNqchGg== [fileUNF]library(tidyverse)library(haven)library(glue)library(stargazer)library(kableExtra)library(emmeans)library(patchwork)library(boot)library(mice)library(ggdag)library(clipr)the_caption <- "Reproduction data from Terence Wood et al, 'The Effect of Geostrategic Competition on Public Attitudes to Aid'"# Data needed downloaded manually from Harvard Dataverse# https://dataverse.harvard.edu/dataset.xhtml?persistentId=doi:10.7910/DVN/3VVWPLaust <- read_stata("1 Australia data JEPS FINAL.dta") %>% mutate(treatment_group = as_factor(treatment_group))nz <- read_stata("2 NZ data JEPS FINAL.dta") %>% mutate(treatment_group = as_factor(treatment)) %>% rename(too_much_aid = toomuchaid, more_to_pac = morepac, favour_nz = favournz)# nz gets this error, but it is only a problem for the print method# Error in gsub(finish, start, ..., fixed = TRUE) : # input string 3 is invalid UTF-8#-------------Australian models--------------------aust_mods <- list()all_response_vars <- c("too_much_aid", "more_to_pac", "favour_aus")all_response_labs <- c("Too much aid", "More to Pacific", "Help Australia")for(i in 1:length(all_response_vars)){ form <- as.formula(glue("{all_response_vars[[i]]} ~ treatment_group")) aust_mods[[i]] <- lm(form, data = aust) }# Regression results:stargazer(aust_mods[[1]], aust_mods[[2]], aust_mods[[3]], type = "html", dep.var.labels = all_response_labs, title = "Regression results for Australians") %>% write_clip()#---------------------New Zealand models------------------nz_mods <- list()all_response_vars_nz <- c("too_much_aid", "more_to_pac", "favour_nz")all_response_labs_nz <- c("Too much aid", "More to Pacific", "Help New Zealand")for(i in 1:length(all_response_vars_nz)){ form <- as.formula(glue("{all_response_vars_nz[[i]]} ~ treatment_group")) nz_mods[[i]] <- lm(form, data = nz) }# Regression results:stargazer(nz_mods[[1]], nz_mods[[2]], nz_mods[[3]], type = "html", dep.var.labels = all_response_labs_nz, title = "Regression results for New Zealanders")… and here are the results for the New Zealand side of the experiment. Again, these match the original article. Note that the New Zealand experiment only had one version of the vignette on the Chinese aid program (unlike the Australian which had ‘forceful’ and ‘measured’ versions).
Table 1b - Regression results, experiment with three response variables, New Zealand public
Regression results for New Zealanders| Dependent variable: | |||
| Too much aid | More to Pacific | Help New Zealand | |
| (1) | (2) | (3) | |
| Vignette | -0.077*** | 0.070** | -0.027 |
| (0.028) | (0.030) | (0.031) | |
| Control group mean | 0.350*** | 0.310*** | 0.531*** |
| (0.020) | (0.021) | (0.021) | |
| Observations | 1,070 | 998 | 1,070 |
| R2 | 0.007 | 0.005 | 0.001 |
| Adjusted R2 | 0.006 | 0.004 | -0.0002 |
| Residual Std. Error | 0.463 (df = 1068) | 0.474 (df = 996) | 0.500 (df = 1068) |
| F Statistic | 7.341*** (df = 1; 1068) | 5.422** (df = 1; 996) | 0.798 (df = 1; 1068) |
| Note: | *p<0.1; **p<0.05; ***p<0.01 |
Contrasts
Tables (2), (4) and (6) of the original Australian table present the contrasts between the ‘measured’ and ‘forceful’ versions of the vignette on Chinese aid activity. There’s no significant evidence that the two versions of the vignette have different effects, but it’s important to check I can get the same results. Here’s my estimate of those contrasts, calculated with the help of the emmeans R package by Russell Lenth et al.
Table 2 - Contrast between effect of two vignettes - ‘measured’ and ‘forceful’ - on three different response variables
| response | 'Measured' minus 'Forceful' | SE | df | t.ratio | p.value |
|---|---|---|---|---|---|
| Too much aid | -0.01 | 0.03 | 1813 | 0.49 | 0.62 |
| More to Pacific | 0.04 | 0.03 | 1644 | -1.33 | 0.18 |
| Help Australia | -0.03 | 0.03 | 1841 | 1.19 | 0.24 |
emmeans is a nice package for comparing different levels of a factor in a linear model. It helps create plots of the comparisons too, looking after the tedious calculations of confidence intervals for you. This next chart, for just one of the response variables, is similar to Figure 1 from the original article. It shows the average proportion of the sample favouring the national interest as a motivation for aid for the different types of treatment. The red arrows inside the bars are an interpretive aid to help make confidence intervals for comparisons between two different effects, whereas the blue bars are the confidence intervals for a single level of the effect.

This finding - exposure to information about China leads to more support for a poverty-focused Australian aid program - is definitely interesting, and as mentioned earlier not what would be expected. It’s worth noting that it didn’t replicate with the New Zealand data. My main question about the interpretation of this finding is how much it depends on the vignette about Chinese aid activity, as opposed to a general priming on aid.
The three treatments in the Australian case were a strident piece on Chinese aid, a measured one, and no information at all. The comparison that would be interesting for future research would be a vignette about aid but perhaps without mentioning specific country donors at all. Because overseas aid and economic development in the Pacific are very low profile topics in Australia, it could be that almost any information about the issues leads to changes in how aid objectives are perceived. But other than noting the lack of obvious difference in impact between the “measured” and “foreceful” treatment groups, I am speculating here.
Here is the R code for the table and chart showing the contrasts between different treatment levels:
#----------Australian Contrasts--------------rbind( as_tibble(pairs(emmeans(aust_mods[[1]], "treatment_group"))[3, ]), as_tibble(pairs(emmeans(aust_mods[[2]], "treatment_group"))[3, ]), as_tibble(pairs(emmeans(aust_mods[[3]], "treatment_group"))[3, ])) %>% # pairs actually gives us the Measured estimate relative to Forceful; we want # the reverse: mutate(estimate = -estimate) %>% # shuffle some stuff for presentation: select(-contrast) %>% rename(`'Measured' minus 'Forceful'` = estimate) %>% mutate(response = all_response_labs) %>% select(response, everything()) %>% kable(digits = 2) %>% kable_styling()#-------------margins plot, Figure 1:---------------p3a <- plot(emmeans(lm(favour_aus ~ treatment_group, data = aust), specs = "treatment_group"), comparisons = TRUE) + labs(x = "Aid should help Australia", y = "")p3b <- plot(emmeans(lm(favour_poor ~ treatment_group, data = aust), specs = "treatment_group"), comparisons = TRUE) + labs(x = "Aid should help the poor", y= "")p3a + p3b + plot_annotation(title = "Telling Australians about Chinese aid might make them more focused on helping the poor", subtitle = "Subjects were given a description of Chinese aid that was either forceful, measured or none (control)", caption = the_caption)
More complex models
The code for Wood et al’s online appendix is available with the rest of the replication data. It involves some more complex models that control for variables other than the treatment, like gender, age and income. And they use logistic regression rather than ordinary least squares, with a possible gain in robustness of findings at a considerable cost in ease of interpretability.
Even with data from a randomised control trial (which this study can be considered an example of), it is good practice to fit a statistical model that adjusts for explanatory variables that aren’t of direct interest. This definitely leads to better estimates of the treatment effect. Maybe the main article should have done this, rather than relegating this analysis to the online appendix, but I can see an argument for focusing on the simplest comparison in the main text.
Having fit the more complete model, an interpretive problem comes from the presentation of the results of that regression. Philosophically, there is a profound difference between the coefficients in front of the treatment variable (in this case, “did you get a vignette about China’s activities in the Pacific”) and those for the control variables. This difference is important enough to have its own name, Table 2 Fallacy, so called because in some fields Table 1 in a journal article is typically basic summary statistics about the sample and Table 2 presents the results of a regresssion with the coefficients for the treatment and confounder variables. The term Table 2 Fallacy was coined in 2013 by Westreich and Greenland.
The coefficient for the primary treatment can be legitimately interpreted as “the total impact of this variable on the outcome”. This is fine, and this inference is usually the whole justification of the experiment. However, the coefficients in front of the other variables can only be interpreted as “the impact of this variable, after controlling for the particular confounding variables in this model”. The critical differences come from the choice of variables to include in the model, some of which are on the causal path between other variables and the outcome of interest.
“In sum, presenting estimates of effect measures for secondary risk factors (confounders and modifiers of the exposure effect measure) obtained from the same model as that used to estimate the primary exposure effects can lead readers astray in a number of ways. Extra thought and description will be needed when interpreting such secondary estimates.”
Westreich and Greenland in “The Table 2 Fallacy: Presenting and Interpreting Confounder and Modifier Coefficients”
Basically, while we have the power of a controlled experiment for drawing inferences about the main treatment, we are back in the world of observational inference with the other variables.
In the case of this attitudes to aid study, here is my crude attempt at a causal diagram of the variables we have data on plus one latent unobserved variable (“political views”) that is of obvious importance:

Because the treatment (which_vignette) does not impact on any of the secondary variables (academic status, background political views, gender, etc) and is not impacted by them (because it was allocated at random), we can safely conclude that the estimated effect for the treatment is the total effect. This applies whether we control for the secondary variables (as we are about to) or we don’t (as was the case in the main paper, and the tables of results shown above).
In the case of the other variables, there are big complications. For example, all four of the variables gender, income, age and academic status are expected to impact on attitudes to aid, but probably mediated by the unobserved general “political views” variable. The variables all have complex relations with eachother and with political views; for example, gender impacts on income (in complex ways that might relate to the individual and certainly to the environment they are in), and both gender and income impact on political views. If income is excluded from the model, some of the reported gender effect will in fact be a proxy for an income effect. In other words, if there are important variables we have missed from the model (and there might be some we haven’t thought of here), we get omitted-variable bias. We can never be sure that (for example) the gender effect in relation to attitudes to aid isn’t standing in as a proxy for something else related to that “political views” circle.
Here’s how I drew that causal graph with R. Everyone should draw more causal graphs, I think.
#===============extra analysis with more variables================#--------------Direction of causality-------------# Direct graph (not 'acyclic' because the connections go in circles!)dagified <- dagify(aid_attitude ~ which_vignette + political_views, political_views ~ income + gender + age + academic, income ~ gender + age + academic + political_views, academic ~ gender + age + political_views, latent = "political_views", outcome = "aid_attitude" )# Draw causal graphset.seed(123)tidy_dagitty(dagified) %>% ggplot(aes(x = x, y = y , xend = xend, yend = yend)) + geom_dag_edges_arc(edge_colour = "grey50") + geom_dag_node(colour ="grey80") + geom_dag_text(colour = "steelblue", family = main_font) + theme_void(base_family = main_font) + labs(title = "Simplified causal diagram of factors in this experiment and views on aid", caption = the_caption)
So having fit the results, how to present them without leading readers into Table 2 fallacy? The obvious thing is to just highlight that these are two different types of effect. Here’s how I did that with the three regressions in question - one for each of the outcome variables included in Table 1:


I’m frankly not sure of the best terminology here. Westreich and Greenland say “extra thought and description” is needed for secondary estimates, but what’s the one word to put in my legend of these charts? I’ve chosen “mediated” because it so happens they are all mediated by the “political views” latent variable, but in other situations this wouldn’t be quite right.
Anyway, I’m pretty happy with those charts. I like the way the confidence interval is shown directly (rather than in a mess of numbers as per the table of regression coefficients that is still - shockingly - standard in academic hournlas). I like the way the total effects are distinguished from the more complex, mediated ones. And I like the way we can see that:
- people from an academic background are much less likely to say Australia gives too much aid or that aid should help Australia, and this seems to be a stronger effect than whether the respondent was given a China vignette or not;
- that older people and men are more likely to support giving more aid to the Pacific
- no evidence that income impacts on these attitudes
That last case is an interesting one in the light of Table 2 fallacy. I expected income to relate to aid attitudes, but more because of how it stands as a proxy for industry, occupation, age, education and indeed general attitudes to life. So the more of these other variables we can include in the model, the less omitted-variables bias we get and the lower the income effect.
Here’s the R code for fitting these logistic regression models with multiple explanatory variables. Note that we have a material amount of missing income information. To get around this I impute income, and include the imputation algorithm within a bootstrap, so the randomness of the imputation is reflected in the eventual estimates.
The process of imputing and fitting the model to one sample is done in the my_reg() function. I use the handy mice package to do the imputation, even though I’m not using all the multiple-imputation functionality in that package, just imputing a set of individual values. The imputatin and regression function is then called multiple times with different bootstrap resamples by boot from the invaluable boot package.
This is a method I use all the time - good, powerful, robust, general-purpose approach to many regression problems.
#-----------Bootstrap and imputation---------------------#' Imputation and regression#' #' @param d data frame with the necessary columns in it#' @param w 'weights' used to indicate which rows of d to usemy_reg <- function(d, w = 1:nrow(d), resp_var = c("too_much_aid", "more_to_pac", "favour_aus")){ resp_var <- match.arg(resp_var) d_select <- d %>% rename(y = ) %>% mutate(y = as.numeric(y), # eg 1 = 'Favour Aus', 0 = 'Help overseas' male = as.numeric(male), over_fifty = as.numeric(over_fifty), academic = as.numeric(academic), log_inc_pp = log(income_per_person)) %>% select(y, treatment_group, male, over_fifty, academic, log_inc_pp) d_imputed <- complete( mice(d_select[w, ], m = 1, printFlag = FALSE, method = c("cart", "cart", "cart", "cart", "cart", "norm")) ) tmp <- dim(with(d_imputed, table(y, treatment_group))) if(length(tmp) == 2 && tmp[1] == 2 && tmp[2] == 3){ full_mod <- glm(y ~ treatment_group + male + over_fifty + academic + log_inc_pp, data = d_imputed, family = "quasibinomial") return(coef(full_mod)) } else { return(NULL) }}# Demo use:my_reg(aust, resp_var = "more_to_pac")# Apply to all three different response variables, bootstrapped 999 times eachboot_reg <- lapply(all_response_vars, function(v){ set.seed(123) boot(aust, my_reg, R = 999, resp_var = v)})boot_plots <- list()for(j in 1:length(boot_reg)){ x <- lapply(1:7, function(i){boot.ci(boot_reg[[j]], type = "perc", index = i)$percent[4:5]}) set.seed(322) boot_plots[[j]] <- do.call(rbind, x) %>% as.data.frame() %>% mutate(variable = c("Intercept", "Measured vignette re China", "Forceful vignette re China", "Male", "Over fifty", "Academic", "Log Income Per Person"), var_type = rep(c("doesn't matter", "Total", "Mediated"), c(1, 2, 4))) %>% cbind(point = my_reg(aust, resp_var = all_response_vars[[j]])) %>% filter(variable != "Intercept") %>% rename(lower = V1, upper = V2) %>% mutate(variable = fct_reorder(variable, point)) %>% ggplot(aes(x = point, y = variable)) + geom_vline(xintercept = 0, size = 2, colour = "brown", alpha = 1/4) + geom_segment(aes(xend = lower, x = upper, yend = variable, colour = var_type), size = 4, alpha = 0.25) + geom_point() + guides(color = guide_legend(override.aes = list(alpha = 1) ) ) + labs(caption = the_caption, x = glue("Impact (on log-odds scale) on probability of saying '{all_response_labs[j]}'"), y = "", colour = "How to interpret the effect of the variable:", title = "The effect of geostrategic competition on public attitudes to aid", subtitle = str_wrap(glue("Impact of a measured or forceful vignette about Chinese aid, and other secondary variables, on likelihood of supporting '{all_response_labs[j]}'"), 80))}boot_plots[[1]]boot_plots[[2]]boot_plots[[3]]That’s all folks. Today’s thoughts:
- Interesting research problem and data set.
- Great to have the code and data.
- It’s worth reflecting on how to interpret coefficients from regression models fit to experimental data; and be careful how you present secondary effects next to the primary variable of interest.
- Put your imputation inside the bootstrap to properly account for the uncertainty it introduces.
R-bloggers.com offers daily e-mail updates about R news and tutorials about learning R and many other topics. Click here if you're looking to post or find an R/data-science job.
Want to share your content on R-bloggers? click here if you have a blog, or here if you don't.
The post Reproduce analysis of a political attitudes experiment by @ellis2013nz first appeared on R-bloggers.


 ︎
︎


 Cell by cell, we unravel the mysteries of the brain. Drawing by Pracha Jaruprateepkul [
 by
by 


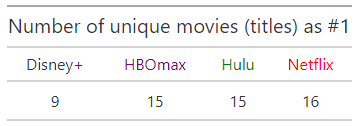


 The same for the movies / TV shows reached the first place in weekly count


 Average days in top distribution
 The same for the movies / TV shows reached the first place in weekly count (#1)
 By Anna Kozak
 plot(rf_mprofile)
 plot(rf_mprofile_group)
 plot(rf_mprofile, lm_mprofile)


 The weekly puzzle from


